Angelina Ritacco —
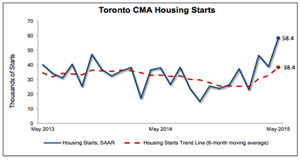
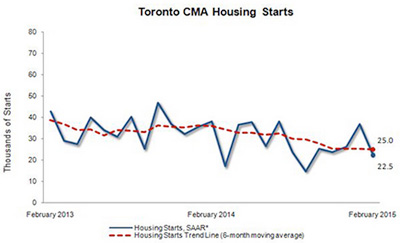
Housing starts in the Toronto Census Metropolitan Area (CMA) trended slightly lower at 25,044 units in February compared to 25,268 in January according to Canada Mortgage and Housing Corporation (CMHC). The trend is a six month moving average of the monthly seasonally adjusted annual rates (SAAR)1 of housing starts.
“February was the coldest month on record for the GTA and frigid temperatures have pushed back some large condominium projects from getting off the ground,” said Dana Senagama, CMHC’s Principal of Market Analysis for the GTA. “However, more high-rise starts are expected this year due to an increase in pre-construction condominium apartment sales since mid-2013”.
CMHC uses the trend measure as a complement to the monthly SAAR of housing starts to account for considerable swings in monthly estimates and obtain a more complete picture of the state of the housing market. In some situations, analysing only SAAR data can be misleading in some markets, as they are largely driven by the multiples segment of the markets which can be quite variable from one month to the next.
The stand alone monthly SAAR was 22,498 units in February, down from 37,015 units in January. The decrease was the result of a significant drop in apartment starts this month.
The City of Toronto recorded the highest number of starts in February, made up of mostly condominium apartments. The next highest level of starts was recorded in Brampton, which saw the largest number of ground-oriented units begin construction. This was followed by Aurora, which saw a boost in single-detached and row starts.
As Canada’s authority on housing, CMHC contributes to the stability of the housing market and financial system, provides support for Canadians in housing need, and offers objective housing research and information to Canadian governments, consumers and the housing industry.
1 All starts figures in this release, other than actual starts and the trend estimate, are seasonally adjusted annual rates (SAAR) — that is, monthly figures adjusted to remove normal seasonal variation and multiplied by 12 to reflect annual levels. By removing seasonal ups and downs, seasonal adjustment allows for a comparison from one season to the next and from one month to the next. Reporting monthly figures at annual rates indicates the annual level of starts that would be obtained if the monthly pace was maintained for 12 months. This facilitates comparison of the current pace of activity to annual forecasts as well as to historical annual levels.